The Data Visualization with Power BI course equips learners to create professional dashboards and reports that turn complex data into clear, actionable insights. It builds practical skills for effective data storytelling, business intelligence, and data-driven decision-making.
The course covers data import, transformation, modeling, DAX, Power Query, visualization techniques, dashboard design, and multiple data sources. Learners develop practical skills to prepare data, create meaningful reports, communicate insights, and improve reporting efficiency using Power BI.
| Section | Content |
|---|---|
| Course | Data Visualization with Power BI |
| Focus | Data Visualization, Dashboards & Business Intelligence |
| Banner | The Data Visualization with Power BI course equips learners to create professional dashboards and reports that turn complex data into clear, actionable insights. It builds practical skills for effective data storytelling, business intelligence, and data-driven decision-making. |
| Overview | The course covers data import, transformation, modeling, DAX, Power Query, visualization techniques, dashboard design, and multiple data sources. Learners develop practical skills to prepare data, create meaningful reports, communicate insights, and improve reporting efficiency using Power BI. |
| Key Skills | Data Import, Data Transformation, Data Modeling, DAX, Power Query, Dashboard Design, Data Visualization, Data Storytelling |
| Tools | Microsoft Power BI, Power Query, DAX |
| Outcome | Ability to create interactive dashboards, analyze data, communicate insights, and support data-driven business decisions |
Berkeley School of Business, Arts & Sciences
Vision
To develop confident data professionals who can transform complex information into clear visual insights and support smarter, data-driven decisions.
Mission
To build practical expertise in Power BI, data visualization, data modeling, DAX, dashboard design, and data storytelling while strengthening analytical and business intelligence capabilities.
No specific prerequisites are required. Basic computer literacy and familiarity with spreadsheets or data handling are recommended for effective participation.
Explore Power BI’s interface, architecture, and the workflow for building effective dashboards. Learn how to connect data sources and publish reports.
Master Power Query for importing, cleaning, and transforming raw data into analysis-ready formats.
Deploy dashboards to Power BI Service, set up scheduled refresh, manage workspaces, and collaborate with teams.
Berkeley offers expertly developed learning materials tailored to meet participants' needs, ensuring comprehensive coverage of the syllabus and optimal exam preparation.
‣ Tailored Material: Guides are designed to cover the entire syllabus, offering full preparation and deep understanding.
‣ In-Depth Content: Unlike superficial outlines, our materials provide fully developed theories and concepts, equipping participants with complete knowledge.
‣ Strategic Study: We help participants prioritize study time by indicating the weight of each topic, allowing efficient focus on crucial areas.
‣ Difficulty Levels: Topics are labeled as "Awareness" or "Proficiency," guiding participants to allocate time based on the required depth of knowledge.
‣ Comprehensive Coverage: Our materials include detailed theory and a glossary of technical terms to clarify complex concepts.
‣ Effective Learning Techniques: Visual aids and memorization techniques ensure long-lasting retention, helping candidates succeed.
Berkeley’s methodologies equip participants with the essential knowledge and tools for both exams and future success.
Our lecture plan integrates structured learning with interactive teaching methods, promoting engagement and collaboration. This approach ensures a comprehensive understanding of concepts, fostering critical thinking and practical application in real-world scenarios.
Practice sessions offer hands-on experience through guided exercises, enhancing skills and reinforcing knowledge. This practical approach ensures mastery of concepts, promoting.
Mock examinations simulate real test conditions, providing valuable practice and assessment. This helps identify strengths and weaknesses, ensuring thorough preparation and boosting confidence for actual exams.
Evaluates and ensure the quality of the training program and all its deliverables. This is
measured through the following indicators:
‣ Instructors' experience and style in presenting and
explaining topics.
‣ Variety and balance of teaching methods (such as discussions, case studies,
mock exams and videos) used in the course to ensure retention and to match the learning
objectives.
‣ Level of interactivity.
‣ Feedback from program participants
‣ Full
compliance with Institute standards and guidelines for preparation and study requirements and
methodology.
‣ Progress reports from the training program provider.
Ideal for disciplined learners who prefer flexibility
Learn from expert instructors in real-time
Personalized, intensive learning experience
“As a strong advocate for education and human development, I commend Berkeley for its exceptional commitment to empowering future leaders. The institution stands as a symbol of excellence, innovation, and opportunity. Students who walk its halls are nurtured with knowledge, values, and vision—qualities that contribute to building a stronger and more prosperous future for our nation.”
- H.H. Shaikh Khalifa Al Hamid
‣ Exclusive Networking Events: Access invitations to industry-leading events and thought-leadership gatherings featuring renowned speakers.
‣ Monthly Updates: Stay informed with a newsletter highlighting the latest research, events, and activities from the school.
‣ LinkedIn Community Access: Join the Executive Education LinkedIn group for networking and professional development opportunities.
‣ Educational Discounts: Enjoy a 20% discount on open-enrollment programs and access to workshops focused on emerging trends.
‣ Global Alumni Network: Connect with a diverse alumni community through the Berkeley School’s online network and engage in country and interest groups.
Annual Salary Estimates
USA: ~$90,000/year
UK: ~£50,000/year
UAE: ~AED 210,000/year
Canada: ~CAD 85,000/year
KSA: ~SAR 200,000/year
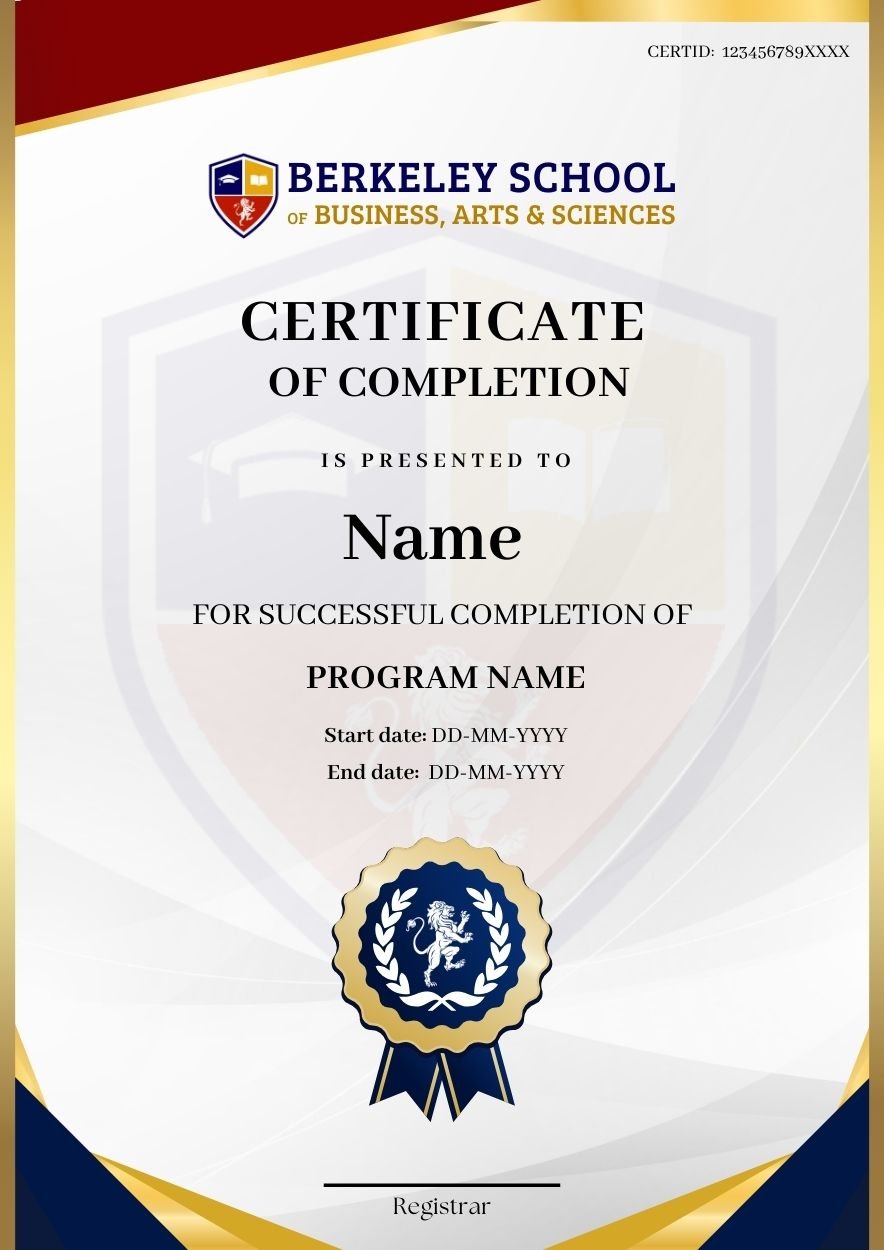
You will get a certificate of completion, which is highly reputed and accepted by employers
Power BI is a top-rated tool used by thousands of global organizations.
Demand for data visualization and Power BI expertise is rapidly growing across sectors
Gain proficiency in DAX, Power Query, visual design, and data modeling
Learn the full cycle of data—from raw input to visual storytelling.
Open doors to high-impact roles in business intelligence and data strategy.